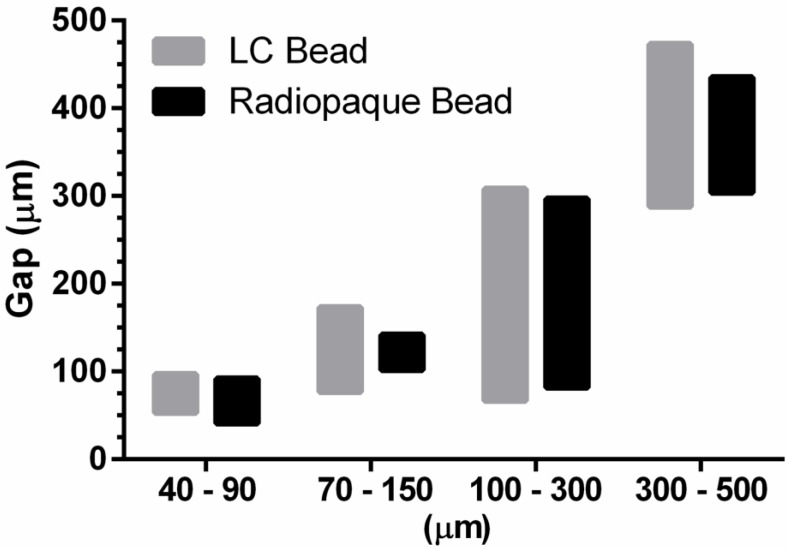
Figure 3.
In vitro penetration assay for LC Bead and Radiopaque Bead. The bar graphs depict penetration potential according to bead size. The bottom of the bar is the maximum penetration of the bead and the top of the bar is the trailing edge of a bead population (0.5 mL aliquot of sedimented beads). The maximum penetration and the the trailing edge for each size range was measured and displayed as an average (N=3).

