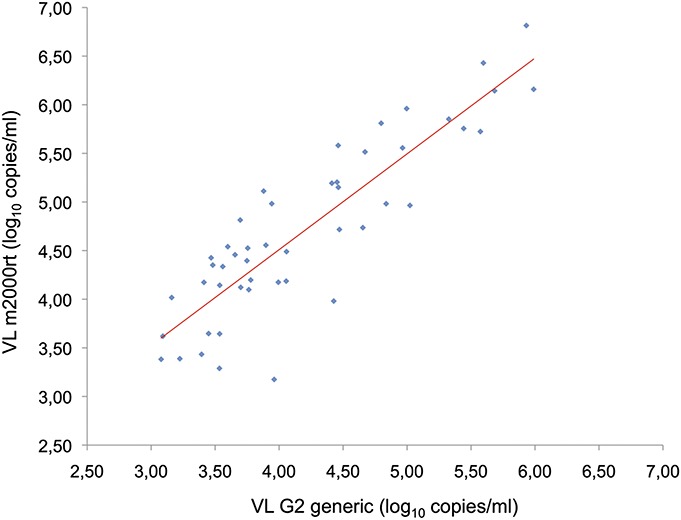
FIGURE 1.

Correlation between paired VL measurements obtained with the m2000rt (Abbott, Chicago, IL) and G2 generic (Biocentric, Bandol, France) assays for samples with VL above 1000 copies per milliliter (N = 48). The solid line represents the fitted regression. Pearson coefficient of determination r2 = 0.772, P < 0.0001.
