
Figure 2.
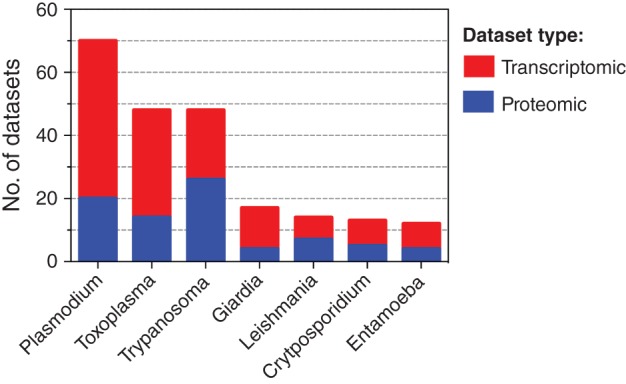
Distribution of transcriptomic and proteomic datasets uploaded to EuPathDB for selected Protozoan parasites. The number of transcriptomic and proteomic datasets submitted to the EuPathDB60 family of databases (see Table 3) for each Protozoan parasite genus. The total number of datasets is plotted for each parasite group, with the proportion of transcriptomic datasets (colored in red) and proteomic datasets (colored in blue) displayed within each bar graph.