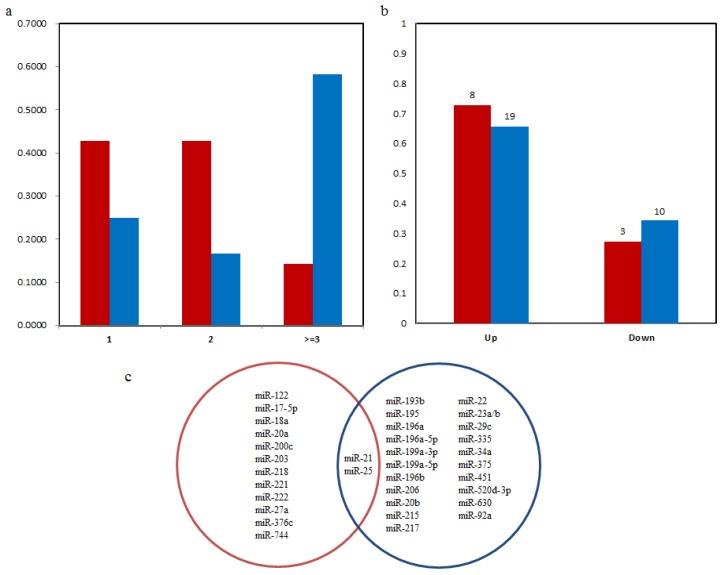
Figure 2.
(a) Distribution of the number of clinicopathological features correlated with microRNAs. X axis is the number of clinicopathological features. Y axis is the percent of microRNAs in blood or tissues that correlated with different number of features. (b) Distribution of expression pattern of microRNA biomarkers from blood and tissues with poor survival of GC patients. Red is the microRNAs from blood and blue is from tissues. Numbers above the bars are the number of microRNA biomarkers in corresponding group. (c) The Venn diagram for microRNA prognostic biomarkers in blood and tissue. Blue and red circles represent microRNAs in tissue and blood respectively.

