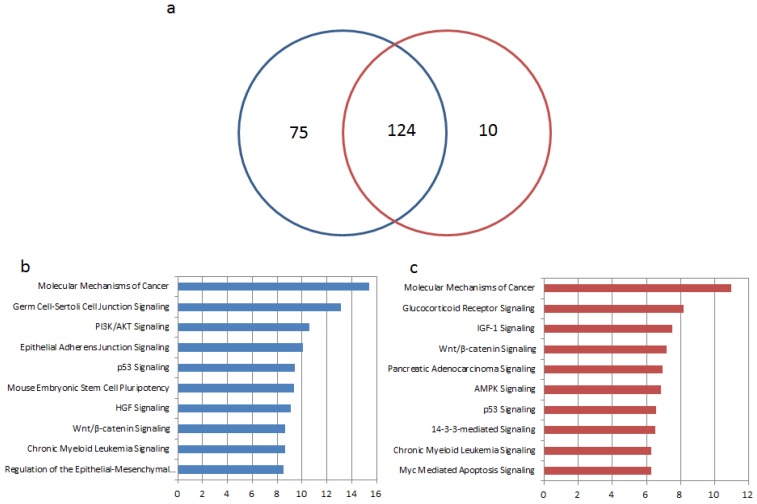
Figure 3.
Enrichment analyses of target genes of microRNA biomarkers in tissue and blood. (a) The Venn diagram for numbers of significantly enriched pathways. The blue and red circles represent pathways enriched by targets of microRNAs in tissue and blood respectively. (b) Top 10 significantly enriched pathways by targets of microRNA biomarker from GC tissue. (c) Top 10 significantly enriched pathways by targets of microRNA biomarker from GC blood.

