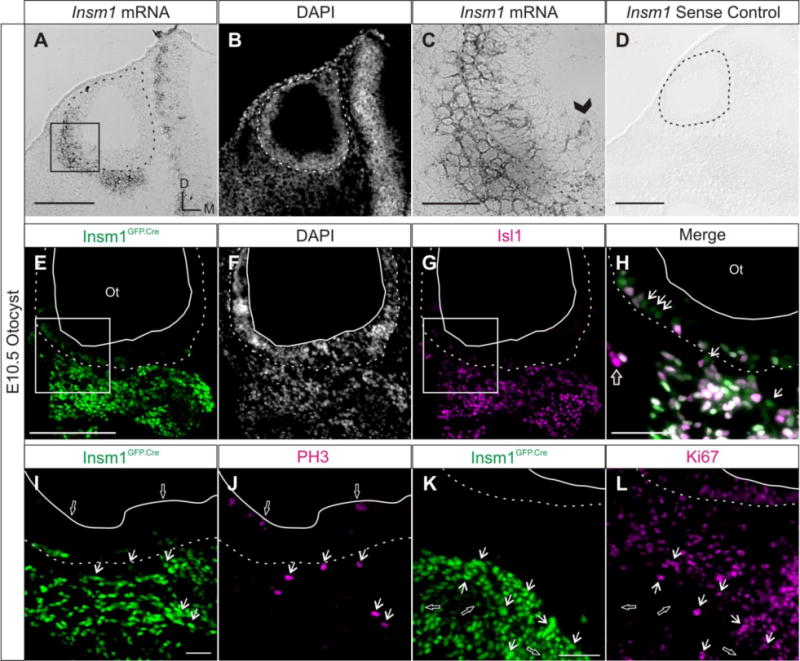
Fig. 3. Insm1 is expressed in delaminating and delaminated neuronal progenitors that will produce the SVG.

Representative horizontal sections of (A–D) wild type and (E–L) Insm1GFP.Cre/+ E10.5 embryos demonstrating the Insm1 expression pattern in the otocyst during delamination. (A) In situ hybridization with an Insm1 antisense probe on a section through the anterior portion of the otocyst. Insm1 mRNA is expressed in DPs within the anteroventral aspect of the otic epithelium and in the mesenchyme. (B) Nuclear pattern of panel (A). (C) Close up of boxed region in (A). Arrowhead indicates an Insm1 positive cell located more apically in the epithelium, presumably prior to delamination. (D) Control in situ hybridization with an Insm1 sense probe shows no signal. (E) Immunohistochemistry for GFP (green) representing Insm1GFP.Cre expression in epithelial and delaminated DPs of the anteroventral otocyst. (F) Nuclear pattern corresponding to panel (E). (G) Immunohistochemistry for DP marker Isl1 (magenta) in the same section as (E,F). (H) Close up of merge of boxed region in panels (E) and (G) shows that the GFP and Isl1 patterns overlap (white), except for a few GFP positive cells not positive for Isl1 (arrows) and even fewer Isl1 positive cells not expressing GFP (open arrow). (I,J) Immunohistochemistry co-staining for Insm1GFP.Cre expression (I, green) and PH3 (J, magenta) shows that Insm1 is not expressed in apically-dividing cells within the epithelium (examples indicated by open arrows), but is expressed by delaminated cells in mitosis (arrows). (K,L) Immunohistochemistry co-staining for Insm1GFP.Cre expression (K, green) and Ki67 (L, magenta) shows that while some Insm1 expressing cells are proliferating (Ki67+; examples indicated by arrows), many are not (examples indicated by open arrows). Dotted lines in all panels delineate the basal lamina of the otocyst. Solid lines delineate the apical edge of the otic epithelium. Boxes indicate regions magnified in panels (C) and (H). (A,D,E) Scale bar: 200 μm. (C,H,I,K) Scale bar: 50 μm. Ot: otocyst.
