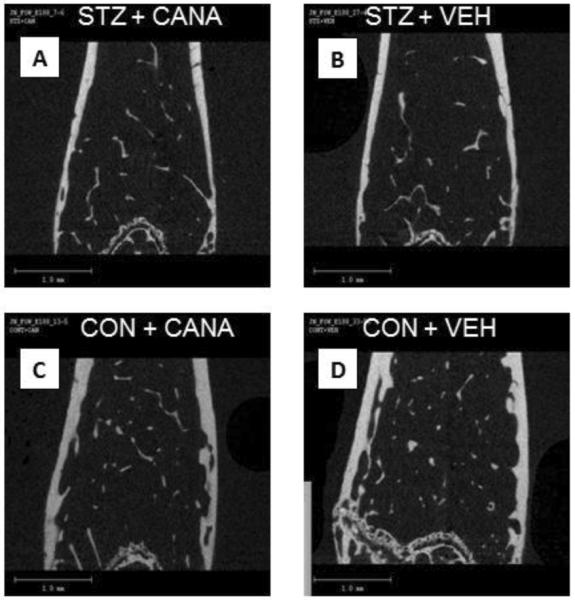
Figure 1. Representative μCT images.

A representative μCT image from each of the four groups is shown; STZ+CANA (A), STZ+VEHICLE (B), CONTROL+CANA (C), and CONTROL+VEHICLE (D). Significant deficits in both cortical and trabecular bone were evident in mice with STZ-induced diabetes (A, B), compared with control mice (D). Specifically, as shown in these images, hyperglycemic mice exhibited decreased trabecular number (Tb.N) and increased trabecular spacing (Tb.Sp); decreased cortical thickness (Ct.Th) and increased cortical porosity (Ct.Po) can also be seen. Canagliflozin treatment did not improve diabetic bone disease, despite blood glucose reduction (A). In contrast, drug treatment of control mice (C) reduced trabecular bone volume fraction (BV/TV), Tb.N and trabecular tissue mineral density (Tb.TMD) while increasing Tb.Sp, compared to untreated control mice (D).
