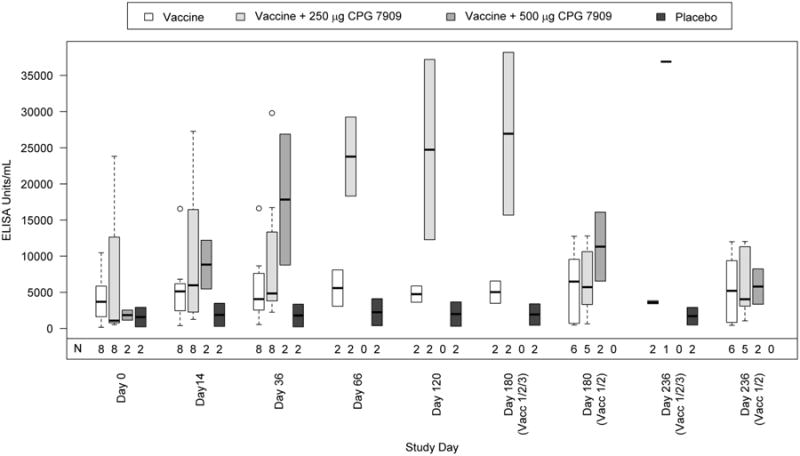
Figure 2.

Summary of IgG response to J5 antigen by visit and study group.
Boxplots of ECL ELISA IgG antibody responses to J5 LPS are shown by study group and visit. The number of subjects evaluated at each study day is indicated (N) and the numbers of subjects receiving all 3 or only 2 vaccine doses are also shown. The dark horizontal bar within each boxplot represents the median antibody response with the 25-75th percentiles indicated by the lower and upper borders of the vertical box. The dotted lines extending from the box (“whiskers”) represent responses of up to 1.5 times the height of the box. Open circles at days 14 and 36 are outliers (i.e. beyond the whiskers).
