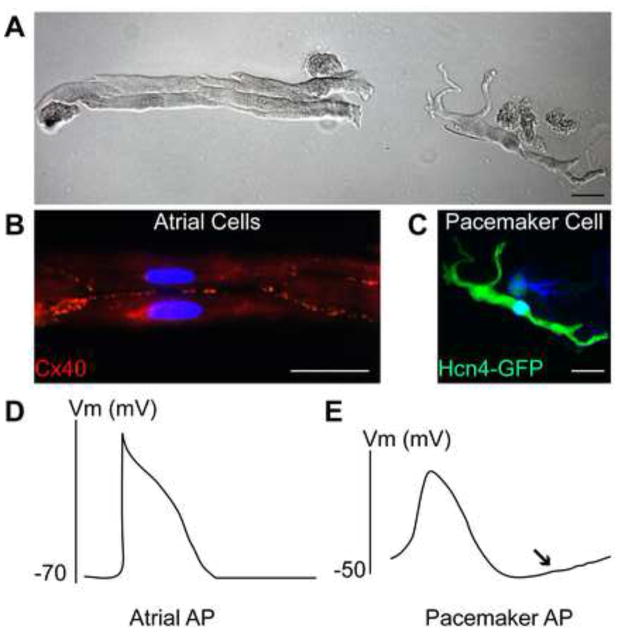
Figure 1. Pacemaker Cells Have Unique Morphology and Electrophysiology [22, 52].
A. Phase-contrast brightfield microscopy image showing isolated mouse cardiomyocytes expressing green fluorescent protein (GFP) under the control of the Hcn4 regulatory region. A cluster of rod-like, striated atrial myocytes is shown on the left. A single pacemaker cell, with striations, but also with several projections and a thinner cell body is shown on the right. B. Fluorescence microscopy image of mouse atrial myocytes as in A. The cluster of GFP-negative atrial myocytes stained with a connexin-40 antibody (red) is indicative of tight cell-cell coupling in atrial tissue. C. Fluorescence microscopy image of a pacemaker cell as in A, positive for Hcn4-GFP and not expressing connexin-40. D. A typical atrial myocyte action potential (AP) has a resting membrane potential of −70 mV or less, a rapid upstroke, and no spontaneous diastolic depolarization. E. A typical pacemaker cell action potential shows a more depolarized maximum diastolic potential, a slow AP upstroke, and a pronounced diastolic depolarization (arrow).

