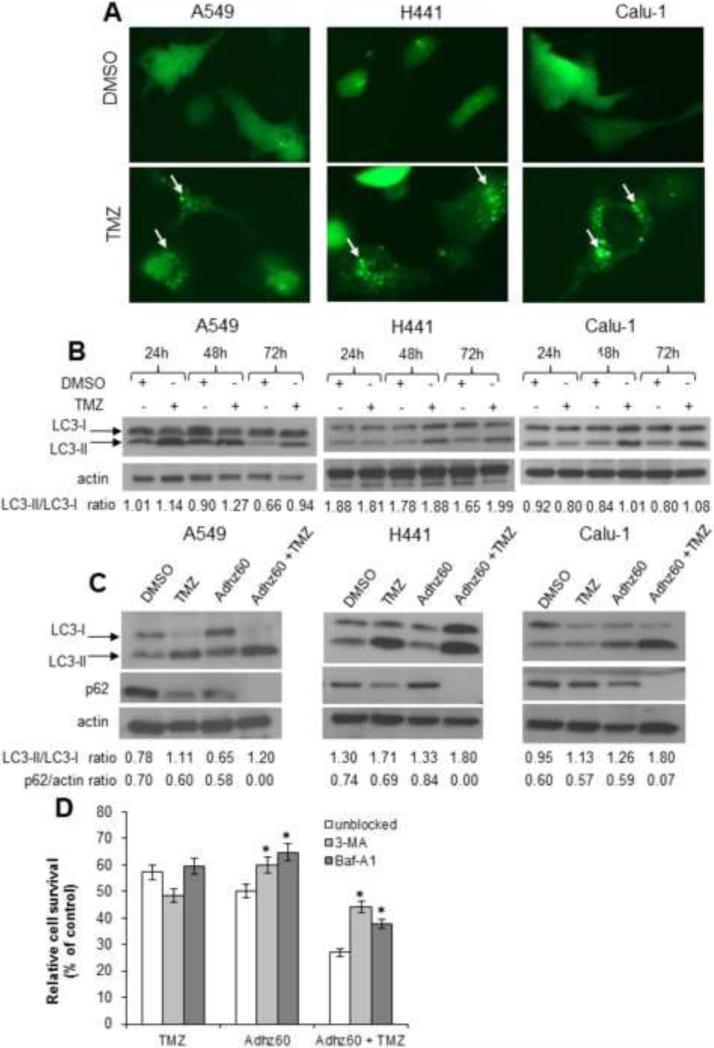
Figure 4. Evaluation of temozolomide (TMZ) ability to induce autophagy in lung cancer cells, enhanced autophagy using combination therapy, and the effect of autophagy inhibition using combined therapy-mediated cytotoxicity.
(A) Lung cancer cells were transfected with pEGFP-LC3 followed by DMSO (A549: 6 μl; H441: 7.5 μl; and Calu1: 10 μl) or TMZ (A549: 0.6 mM; H441: 0.75 mM; Calu1: 1 mM) treatments. Integration of GFP-LC3 into the autophagosome is depicted by punctate structures and was analyzed by fluorescence microscopy at 48h post-treatment. Images were taken at 40× magnification with the EVOS FL Imaging System (Advanced Microscopy Group) under 357/44 (nm) and 447/60 (nm) excitation and emission visualization. The percentage of cells with GFP punctuate pattern was calculated as punctuate GFP cell per total GFP cell %. A representative experiment showing punctuation (arrows) is shown from three performed. (B) LC3 expression and modification were analyzed in a time course assay. (C) Human lung cancer cell lines were treated with Adhz60 and TMZ alone or in combination at the following doses for Adhz60 and temozolomide (TMZ), respectively: A549 (2.5 MOI, 0.6 mM), Calu1 (10 MOI, 1 mM), and H441 (10 MOI, 0.75 mM). DMSO was added as a control at its respective volume for each cell line. Expression of LC3-I, LC3-II, and p62 were evaluated by Western blotting. Actin was used as a loading control. The values indicate the ratios of normalized band intensities of LC3I and LC3II or p62 expression profiles to actin. A representative experiment is shown. (D) A549 cells were cultured in the presence or absence of either 3-MA (10 mM) or BAF-A1 (10 nM). Media containing the drug was removed the next day, and the cells were treated with Adhz60 at a multiplicity of infection (MOI) concentration of 10 or TMZ at 0.75 mM, both for single and combined treatments. Seventy-two hours post-treatment, cell viability was evaluated by MTT assay. Results represent the mean of three independent experiments ± standard deviation (SD; error bars) (*P < 0.05).

