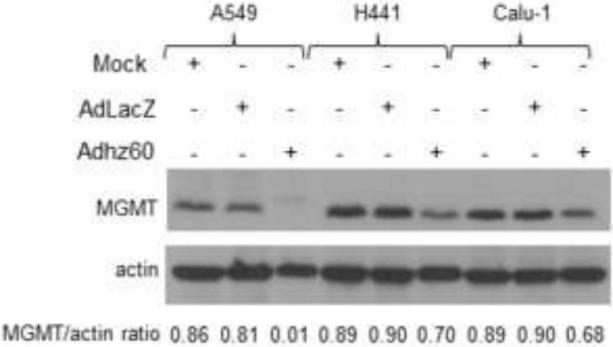
Figure 6. Assessment of MGMT expression.
Human lung cancer cell lines were not infected (mock) or infected with AdLacZ at a multiplicity of infection (MOI) concentration of 10 for all cell lines or Adhz60 at the following doses: A549 (2.5 MOI), H441 (20 MOI), and Calu1 (10 MOI). Whole cell protein lysates were collected 72h after treatment. MGMT was detected by Western blot analysis. Actin was used as a loading control. These values indicate the ratios of normalized band intensities of MGMT to actin expression. One representative experiment from three is shown.

