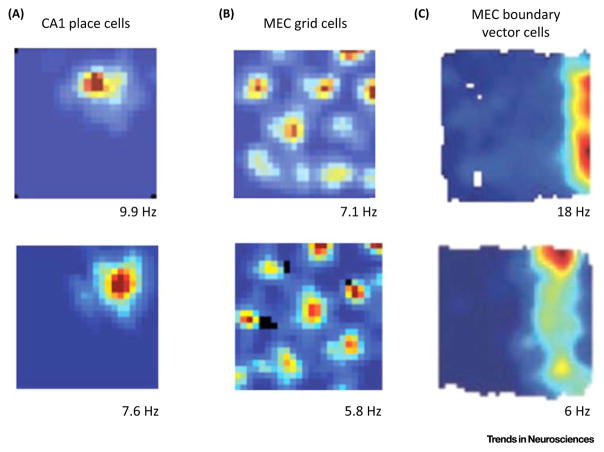
Figure 1. Firing properties of cell types.
Rats forage for food in a square-shaped environment. Whenever a spike occurs, the location of the animal is recorded. The heat map shows the spike rate of a given cell as a function of location. The color scale ranges from no activity in dark blue to the maximum rate in red (shown below maps). (A) CA1 place cells [17]. (B) MEC layer II grid cells, adapted from [17]. (C) MEC boundary vector, cells adapted from [8].

