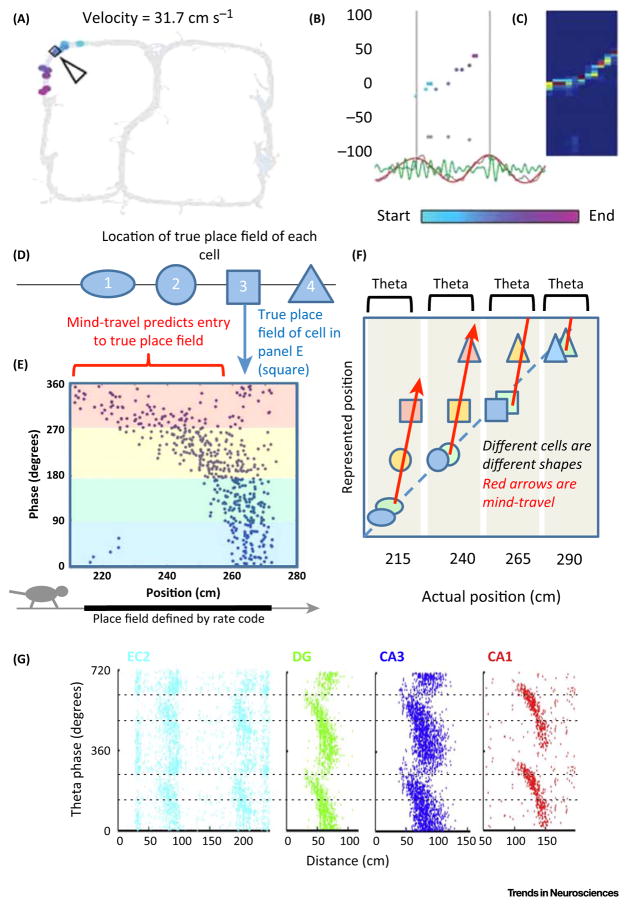
Figure 2. Theta Sequences, Phase Precession, and Mind-Travel.
(A) A sequence of place cells representing locations ahead of the animal fire in sequential order during the second half of the theta cycle. Path of rat shown in grey. The arrow and diamond show the current location of the animal. The colored dots represent the place cells that fired during this theta cycle. The location of the dot corresponds to the center of the place field of that cell. The color corresponds to the theta phase of the spikes from that cell, light-blue meaning early theta phase and light-purple meaning late theta phase. (B) Same data as in A. The x-axis is time; one theta cycle is shown. The y-axis is the position of the center of the place field of each cell (cm). Dots correspond to spikes and are colored the same as in A; grey dots are spikes inconsistent with the sequence. The unfiltered local field potential (LFP) is plotted below (grey) together with theta-band (6–12 Hz) filtered (red) and gamma-band (40–100 Hz) filtered (green) traces. (C) Bayesian decoding of position from spike sequence shown on left. Red denotes high probability, blue low. Axes same as middle. Adapted from [36]. (D) Different cells (designated by different shapes) have true place fields at different positions along path (see position axis in E). (E) At bottom, left-to-right path of rat is shown (arrow) with thick line designating the place field determined by the positions where firing occurs (rate code). During this period there are many theta cycles; each dot represents the theta phase and position of the animal at the time of a spike. Over most of the place field, firing is due to mind-travel and occurs during the second half of theta cycles (yellow and red). Starting at 260 cm, the rat is in the true place field and firing occurs over a broader phase range that is in the first half of theta cycles (blue and green). Adapted from [89]. (F) Position represented by different cells is shown. Cell in E is designated by a square, corresponding to cell 3 in D. Color fill represents theta phase, corresponding to colors in E. Dashed line signifies when represented position corresponds to actual position. During the first half of each theta cycle, cells represent current position; during the second half, they perform mind-travel to upcoming positions (red arrows) as a result of an artificial velocity vector (AAV) integrated by the grid cell network. Each theta cycle is marked by grey background. Only four theta cycles are shown, but there are generally seven to ten during traversal of a place field. (G) Phase precession in different regions analyzed with respect to a common phase reference of the local field potential in layer III of the entorhinal cortex (two cycles are shown). Region between pairs of dashed lines marks phase range where precession is strong. Adapted from [67]. Note that the phase reference used here is different from that in the rest of Figure 2. This panel shows that phase precession occurs nearly concurrently in entorhinal cortex layer II (EC2), dentate gyrus (DG), CA3, and CA1 (albeit with ~30 ms offset in CA1). The order in which the areas are shown corresponds to the order of information flow through the trisynaptic pathway (EC2 onto DG, DG onto CA3, CA3 onto CA1).

