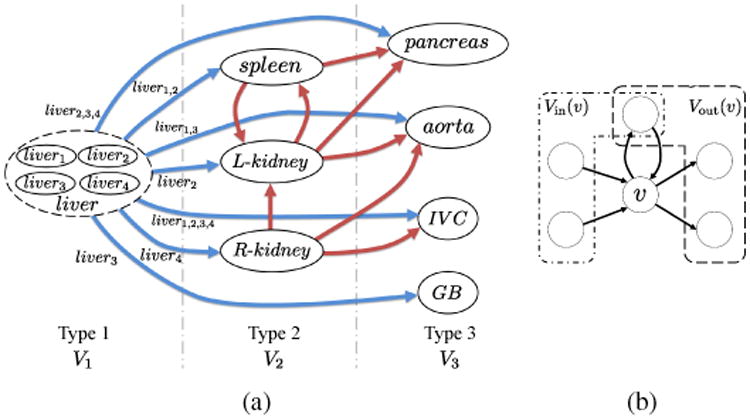
Figure 8.

Organ correlation graph (OCG). (a) OCG constructed from eight abdominal organs. Blue and red edges indicate the edges from nodes of Types 1 and 2, respectively. For simplicity, the multiple edges from the sub-shapes of the liver to a target organ are indicated by one edge from the liver to it and the identifiers of sub-shapes are indicated by the labels on the edges. In the graph, a node having in-edges is predicted from nodes having out-edges. (b) Examples of Vout(v) and Vin(v). As shown in this figure, some nodes can be included in both Vout(v) and Vin(v).
