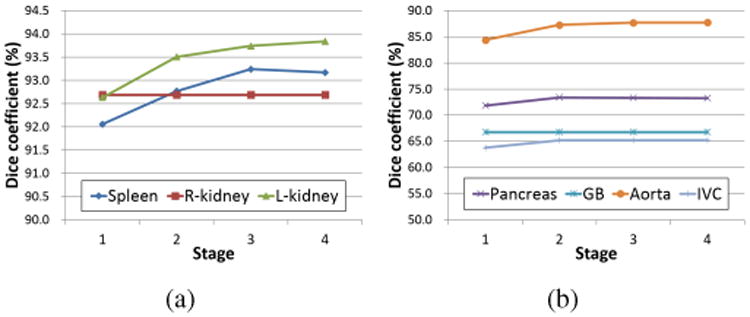
Figure 14.

Effects of multi-stage updating in proposed multi-organ segmentation based on OCG. Average DC of 134 CT data at each stage is plotted for each organ. (a) Plots for the spleen, R-kidney, and L-kidney. (b) Plots for the pancreas, GB, aorta, and IVC. Only the liver was used as the predictor at Stage 1. The spleen, R-kidney, and L-kidney were used as the predictors in addition to the liver at Stages 2 to 4.
