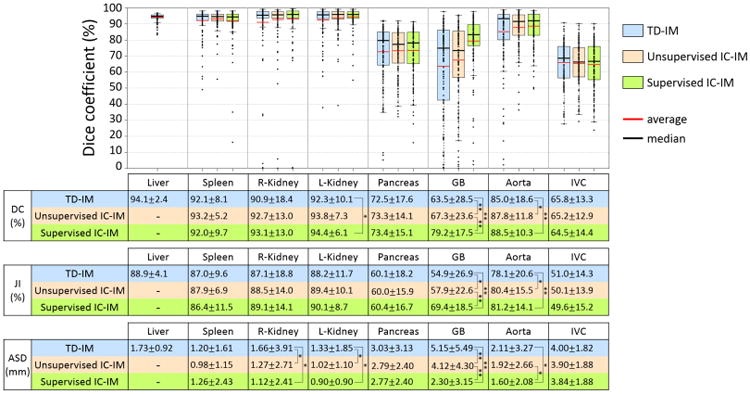
Figure 16.

Summary of accuracy evaluation for three intensity models when the proposed prediction-based shape–location priors were utilized. DCs of 134 CT data using TD-IM, unsupervised IC-IM, and supervised IC-IM for each of eight organs were plotted. With respect to the liver, only the result using TD-IM is shown. Average DC, JI, and ASD values and statistical significance are also shown below the plots in a table format. In the table, * and ** indicate that significant accuracy improvement with significance levels of 0.05 and 0.01 was observed, respectively.
