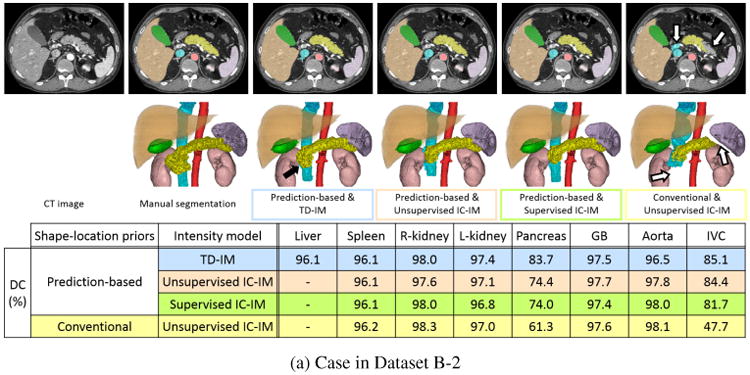
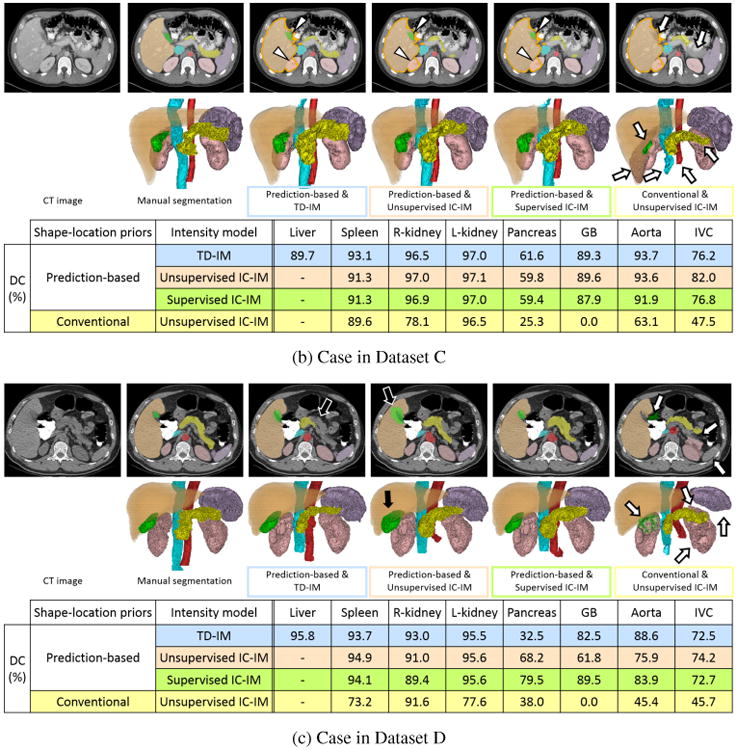
Figure 17.


Illustrative segmentation results (a) Case in Dataset B-2 (arterial phase enhancement). (b) Case in Dataset C (portal venous phase enhancement). (c) Case in Dataset D (non-contrast). From the left to the right, input CT image, manual segmentation, and results using the proposed prediction-based shape–location priors & TD-IM (blue), the proposed prediction-based priors & unsupervised IC-IM (orange), the proposed priors & supervised IC-IM (green), and the conventional priors & unsupervised IC-IM (yellow). Upper Axial cross-section. Lower 3D rendering. Orange, purple, pink, yellow, green, red, and cyan volumes and regions indicate the liver, spleen, kidneys, pancreas, GB, aorta, and IVC, respectively. Dice coefficient (DC) of each segmented organ is also shown in a table format. In (b), orange contour indicates the contour of the liver region to show liver leakage. White arrows show the failed region by the conventional priors. Black arrows show the improved or failed regions by the prediction-based priors. Arrow heads show the regions of liver leakage.
