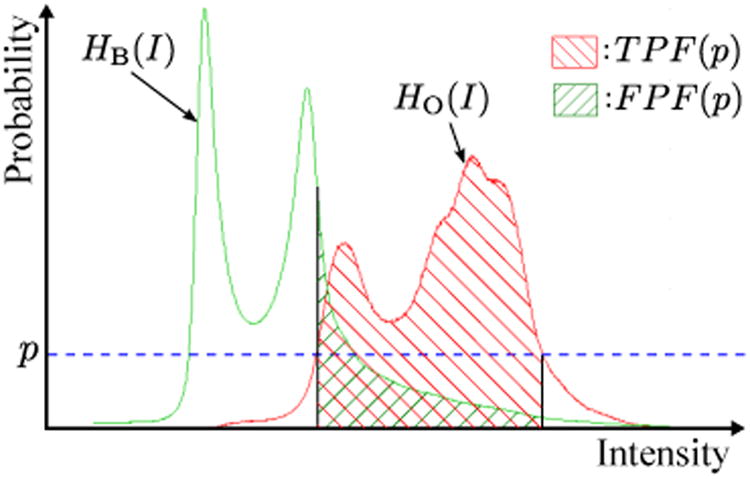
Figure B.2.

Determination of threshold value p̂ for likelihood image. Red and green plots are the histograms of object HO(I) and background HB(I), respectively. Given a probability value p, TPF(p), FPF(p), and Youden's index can be calculated. The threshold value for likelihood image p̂ is determined so that Youden's index is maximized.
