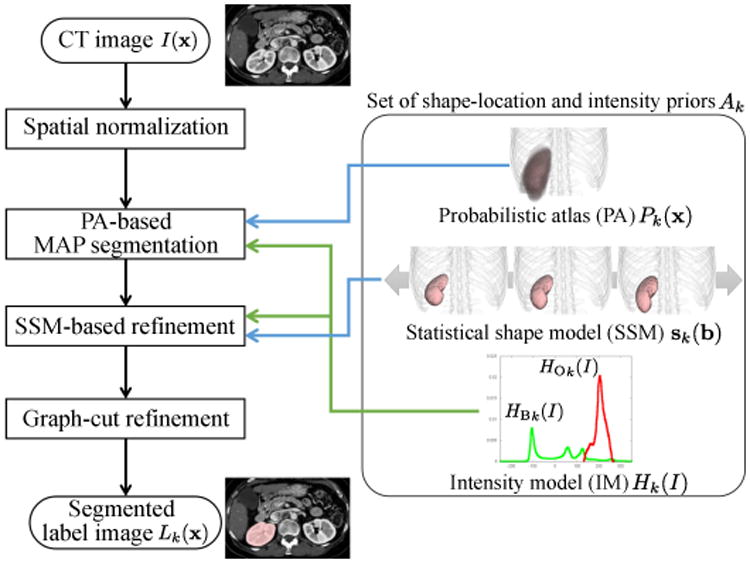
Figure 2.

Block diagram of single-organ segmentation method. As an example, the segmentation target is R-kidney here. This is utilized as a basic module for multi-organ segmentation, where (conventional) PA and SSM will be replaced by prediction-based conditional ones described in Section 2.2. Three methods for constructing intensity models will be considered in Section 2.3.
