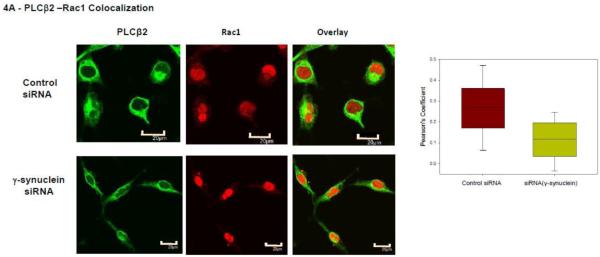
Figure 4. PLCβ2 and Rac1 interactions in MDA MB 231 cells are affected by γ-synuclein knock-down.
A- Co-immunofluroescence studies showing the colocalization of PLCβ2 (green) and Rac1 (red) in MDA MB 231 cells treated with control (n=29) or γ-synuclein (n=30) siRNA. As shown in the accompanying box plots, Pearson’s coefficient between the two groups is statistically significant (p<0.001, Student’s t-test. Positive control= 0.65 +/− 0.12, negative control= 0.03 +/− 0.08). B- Sample FRET images of an MDA MB 231 cell expressing eCFP- Rac1 and eYFP- PLCβ2 where the accompanying box plot shows changes in the normalized FRET efficiencies of cells treated with γ-synuclein (n=83) or control (n=80) siRNA (p<0.001, Rank Sum Test., Positive control = 0.44+/− 0.06, Negative control = 0.03 +/− 0.02).


