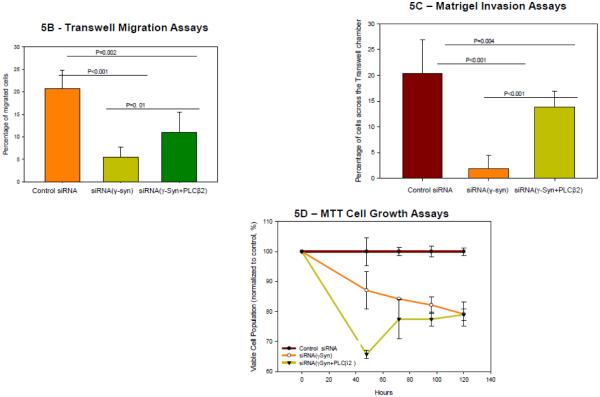
Figure 5. γ-Synuclein and PLCβ2 affect MDA MD 231 cell phenotypes.
A- Sample DIC images of MDA MB 231 cells mock treated or treated with γ-synuclein siRNA and compiled results showing a significant difference in the circularity of cells between the two groups (both n=360, p<0.001, Student’s t-test). B- Transwell migration assay showing the average number of cells treated with control siRNA, γ-synuclein and control siRNA, or γ-synuclein and PLCβ2 siRNA, that migrated per field, determined after fixing the transwell membrane and staining with DAPI after 4 hours of incubation (n=5, ANOVA). C- Transwell Matrigel invasion assay showing the average number of cells treated with control siRNA or γ-synuclein siRNA, that migrated per field, which was determined after fixing the transwell membrane and staining with DAPI after 4 hours of incubation (n=5, p<0.001 Student’s t-test). D- MTT assays were used to evaluate cell growth after treatment with control siRNA, γ-synuclein and control siRNA, or γ-synuclein and PLCβ2 siRNA. Data were expressed as a percentage of the absorbance of control cells at 570nm. The mean ± SEM is shown (n=6).


