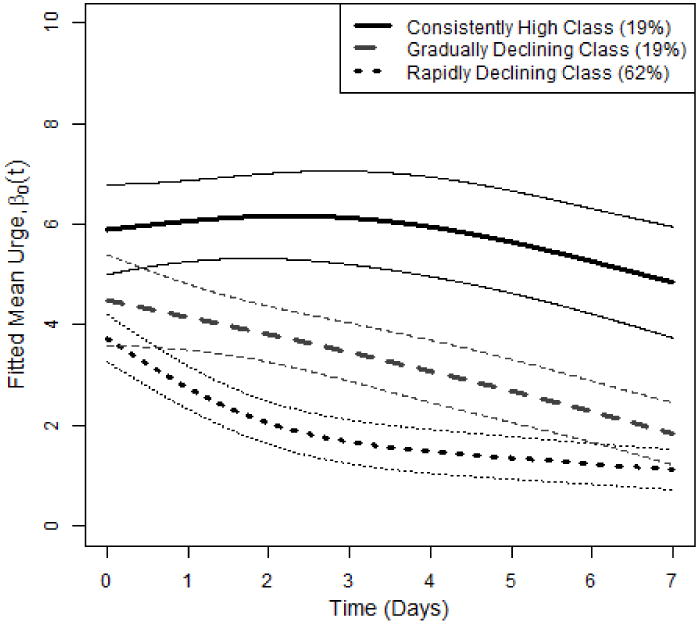
Figure 3.

Fitted coefficients for MixTVEM of urge in Model (9) using a cubic spline with six interior knots and a second-order penalty. The upper panel represents the 3-class model, and the lower panel represents the 5-class model. The heavy curves represent estimated mean trajectories (β0 in Model (9)). The light dotted curves above and below each curve represent estimated 95% pointwise confidence intervals.
