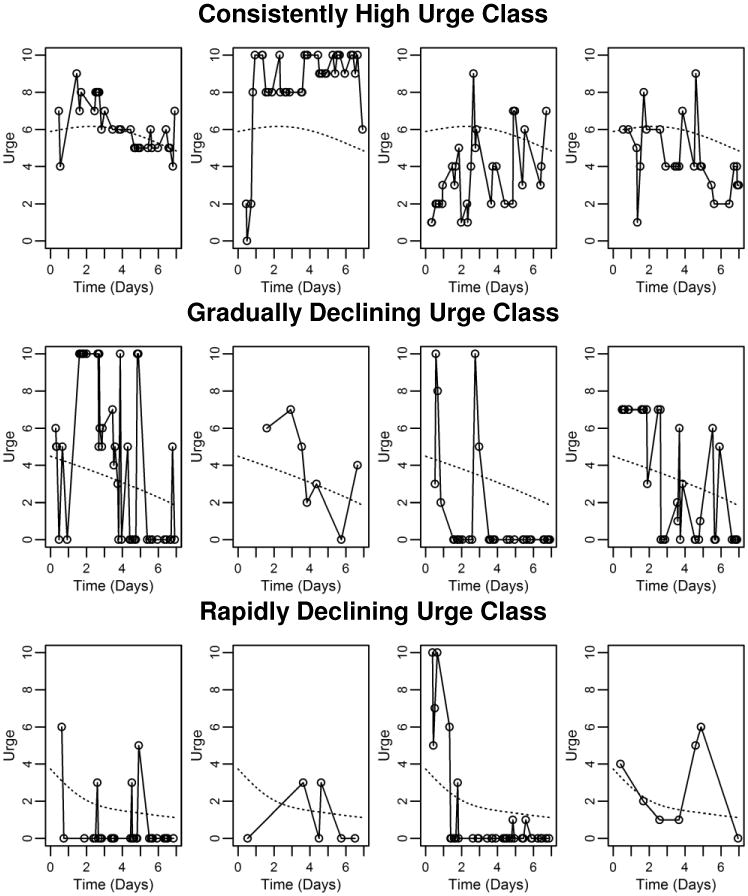
Figure 4.

Observed data for twelve participants. All data on the outcome variable is plotted for four randomly selected participants from each of the three latent classes in Model (9). For comparison, the fitted mean trajectory in each class is shown as a dotted line. In each plot, the y-axis represents self-rated urge and the x-axis represents time in days.
