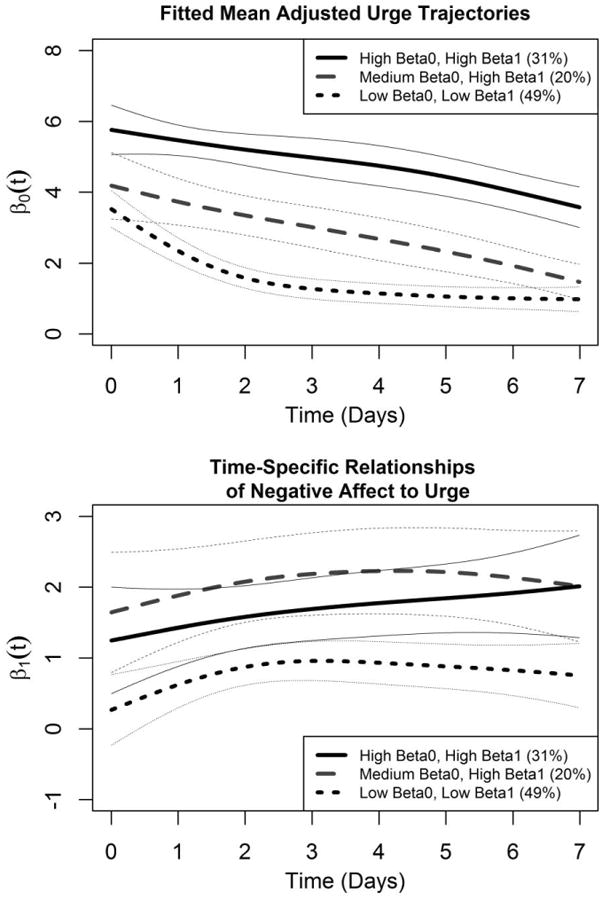
Figure 6.

Fitted coefficients for MixTVEM of urge adjusted for negative affect. The heavy curves represent estimated coefficient functions for β0 (intercept) and β1 (coefficient for negative affect) in Model (10) for each class. The light dotted curves above and below each curve represent estimated 95% pointwise confidence intervals. The β0 function could be considered, roughly, to show the expected course of urge over time if negative affect were held constant. The β1 function measures the strength of relationship between negative affect and urge. The upper panel shows the β0 functions and the lower panel shows the β1 functions.
