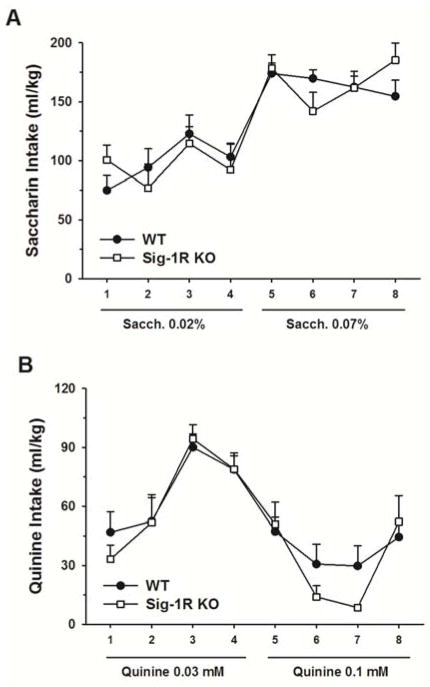
Figure 2.
Saccharin and quinine drinking in WT and Sig-1R KO mice (n=8–10/genotype). Mice were given access to escalating concentrations of either (A) a sweet saccharin solution (0.02% and 0.07% w/v) or (B) a bitter quinine solution (0.03 mM and 0.1 mM), in a home cage, two bottle choice paradigm. Data represent Mean ± SEM.

