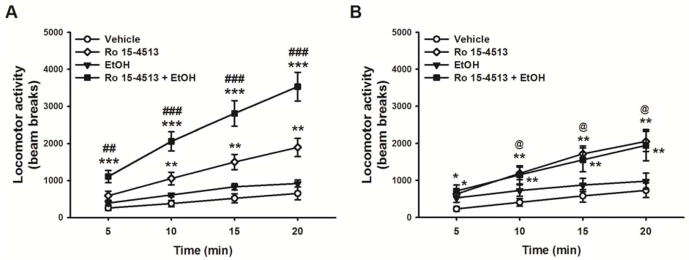
Figure 3.
Locomotor stimulant effect of ethanol in (A) WT mice and (B) Sig-1R KO mice (9–10/genotype). Mice were treated with either ethanol (1.5 g/kg), or Ro 15-4513 (3 mg/kg), or co-administered both drugs, and locomotor activity in a familiar environment was evaluated. Data represent Mean ± SEM. * p≤0.05, ** p≤ 0.01, *** p≤0.001 vs. vehicle treated mice; ## p≤0.01, ### p≤0.001 vs. Ro 15-4513 treated mice, @ p≤0.05 vs. respective point in WT mice (Student Newman-Keuls test).

