Fig. 3.
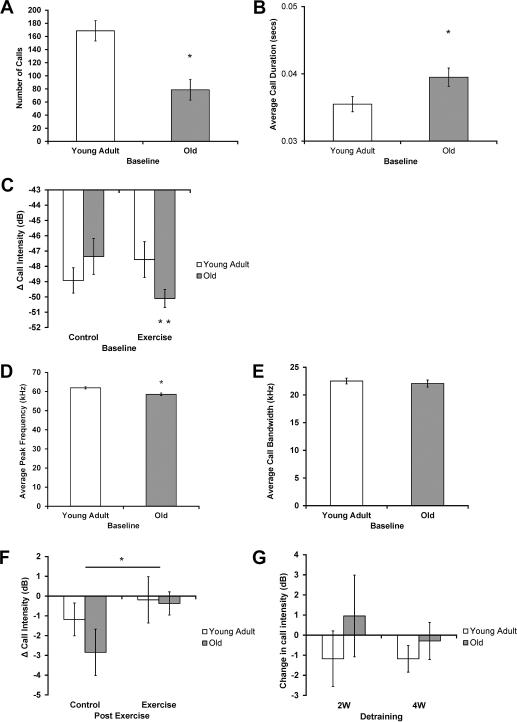
USVs. (A-E). Age-related changes in USV characteristics at baseline. A) Number of calls: Significantly lower (p < 0.001) number of calls in the old group. B) Average call duration: Significantly greater (p=0.03) average duration of calls in the old group. C) Average call intensity: Significantly reduced (p < 0.001) average intensity of calls in the old exercise group, and a decreased average intensity in the old exercise group compared with the old control group (p=0.007). Y axis represents normalized intensity (dB), with smaller numbers representing decreased intensity levels relative to maximum. D) Average Peak Frequency: Significantly lower (p < 0.001) peak frequency of calls in the old group. E) Average bandwidth: No significant age-related differences (p=0.58). F) Maintenance of call intensity found with tongue exercise at the post exercise time point. Significantly smaller (p=0.04) change in intensity of calls in the exercise than the control group. Y axis represents change in normalized intensity (dB). G) No significant difference in intensity following detraining. No difference (Old 2-week [2W]: p=1.0, Young Adult 2W: p=0.28, Old 4-week [4W]: p=0.84, Young Adult 4W: p=0.25) was found in intensity following detraining in either detraining or age group. * Denotes significant values; error bars represent standard error of the mean.

