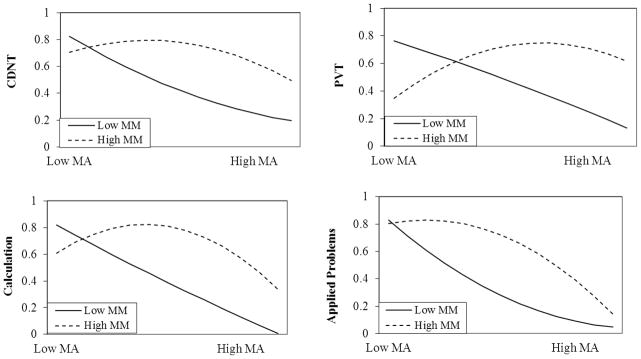
Figure 2.
Relations between MA and math performance as a function of MA and MM. All math performance outcomes have a SD = 1. The scale of the Y axis is in standard deviation units. CDNT = Composing and Decomposing Numbers Task; PVT = Problem Verification Task; MA = math anxiety; MM = math motivation.

