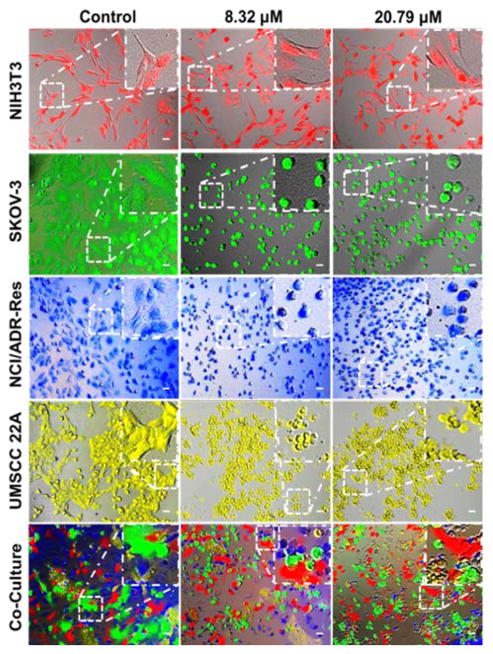
Fig. 3.
Fluorescence images of cancer cells after culturing with different concentrations of PDA-PEG/Cu2+ combination. NIH 3T3, NCI/ADR-Res, SKOV-3 and UMSCC 22A were pre-stained with Cell Tracker™ deep red, blue, green CMFDA and orange CMTMR dye, respectively, and imaged 24 h after the treatment. The scale bars were 40 μm.

