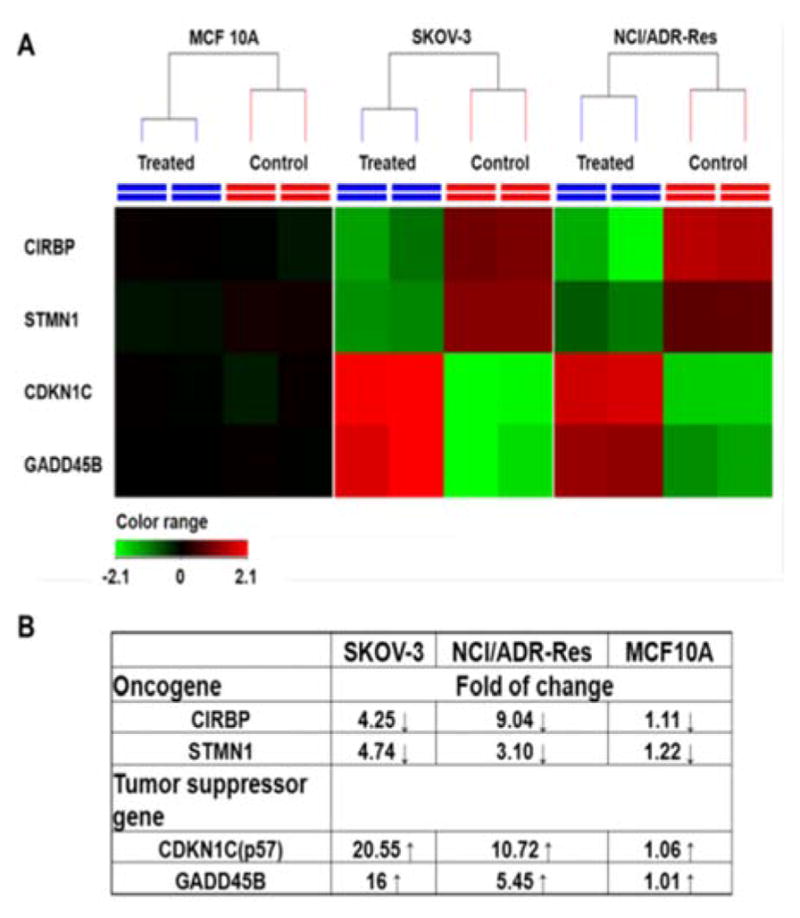
Fig. 6.

RNA expression in response to PDA-PEG/Cu2+ treatment. Cells were treated with 41.58 μM of PDA-PEG/Cu2+ for 12 h. (A) Heatmap RNA level with and without drug treatment. Red: upregulation; green: downregulation; black: no change. (B) Genes alteration fold after treatment.
