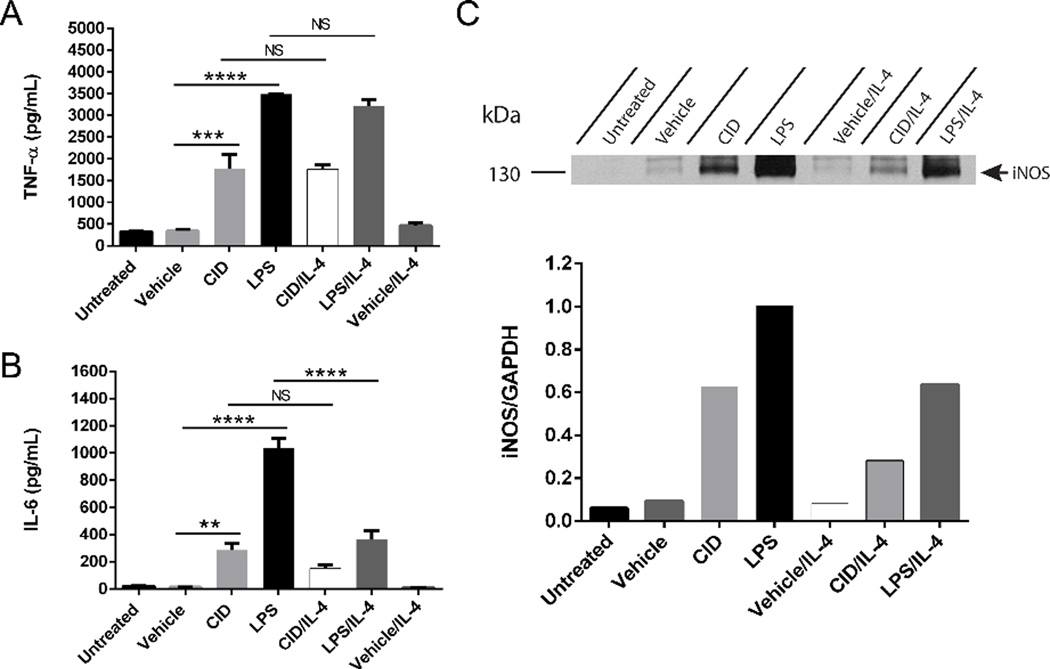
Figure 3. MΦ-cTLR4 cells are influenced by IL-4 treatment.
Expression of classical inflammatory MΦ phenotype markers following cocktail treatment of IL-4 (60 ng/mL) and CID drug (50 nM), LPS (100 ng/mL) or vehicle. Bar graphs show the levels of (A) TNFα and (B) IL-6 of cocktail-treated cells compared to controls. Cell media was collected following 24 hour treatment. (C) Western blot shows intensity of iNOS expression (130 kDa) for cocktail-treated MΦ-cTLR4 cells when compared to controls. Cells were lysed following 24 hour treatment.

