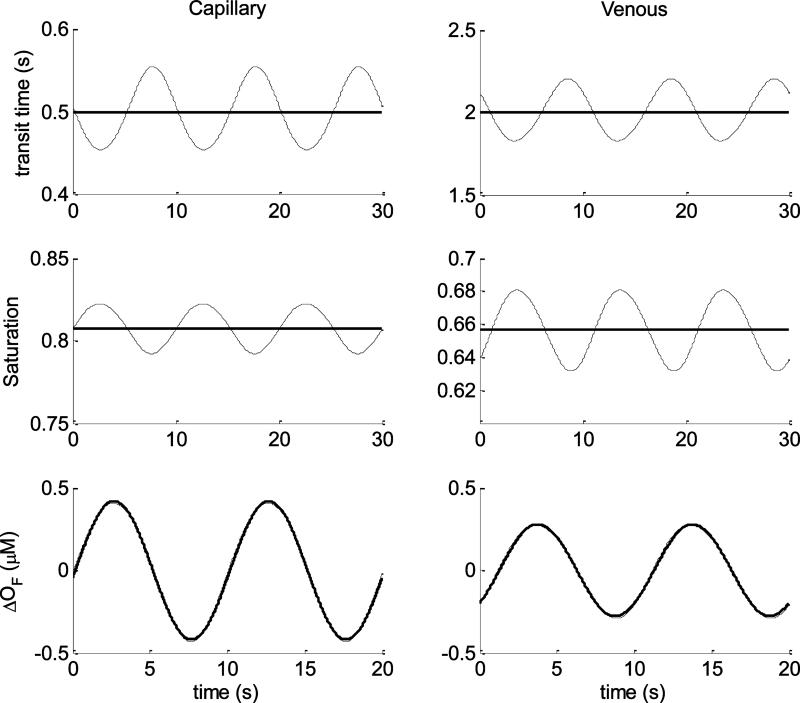
Fig.5.
Time domain comparisons between linear (thick lines) and nonlinear (thin lines) models for sinusoidal capillary and venous blood flow velocities oscillations (having periods T=10 s). The amplitudes of the oscillations is 10% of the baseline values. Left column refers to the capillary while the right column to the venous compartment. Top row represents the transit times, center row the oxygen saturation, bottom row the changes of oxyhemoglobin due to flow changes only. The baseline parameters used for the computation are listed in the text.

