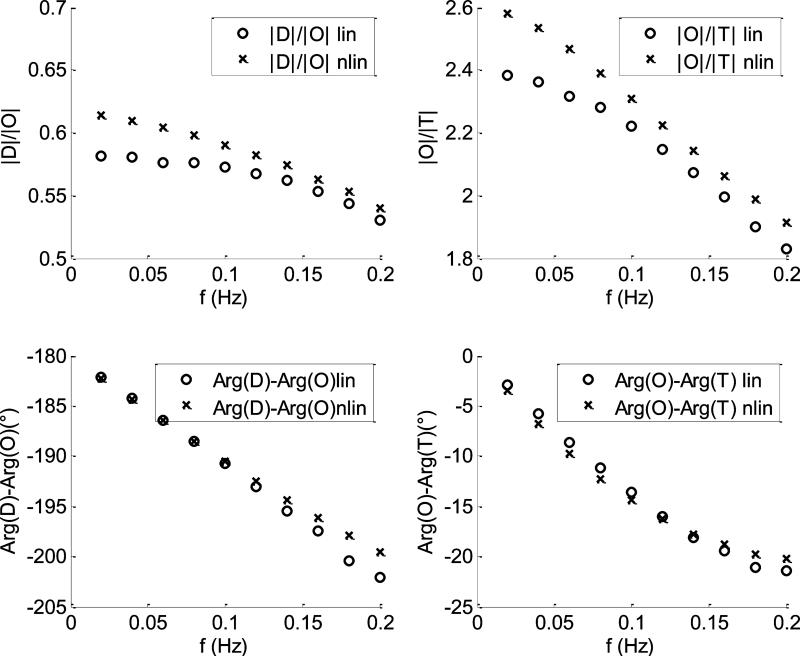
Fig.8.
CHS spectra calculated at ten different oscillations frequencies. The capillary and venous amplitudes of flow oscillations are 50% of their baseline values. The crosses and the empty circles refer to the nonlinear and the linear models, respectively. The baseline parameters of the models are listed in section a).

