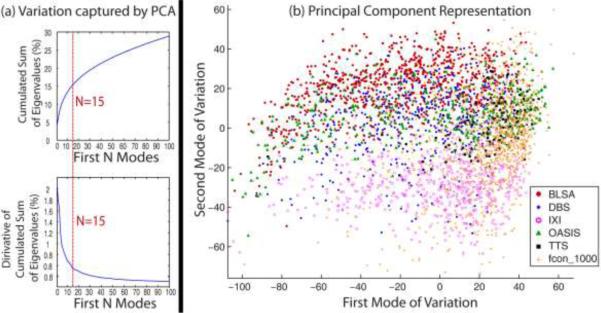
Figure 3.
(a) Total variation captured by first N modes from the PCA projection. The upper left figure shows the total variation captured by first N modes from the PCA. It's got from the percentage of the cumulated sum of the first N eigenvalues among all eigenvalues. The lower left figure shows the derivative of the upper left figure. (b) Coordinate embedding of 3464 training dataset from 6 projects. The first two modes in the PCA low-dimensional space are shown.

