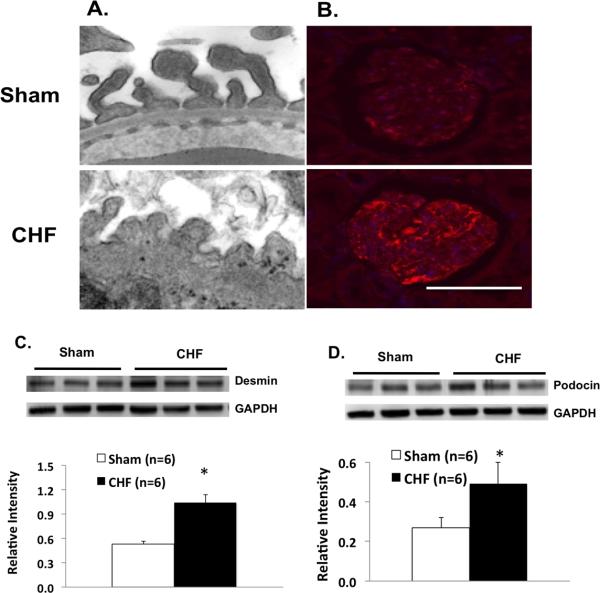
Figure 5.
A. Transmission electron microscopy showing glomerular podocyte in sham and CHF rats. Magnification; 59Kx. B Immunostaining for desmin (a marker of podocyte damage, red). Scale bar: 100 μm. C. Desmin protein expression in the cortex of the kidneys from sham and CHF rats. D. Podocin protein expression in the cortex of the kidneys from sham and CHF rats. * P < 0.05 vs. sham.

