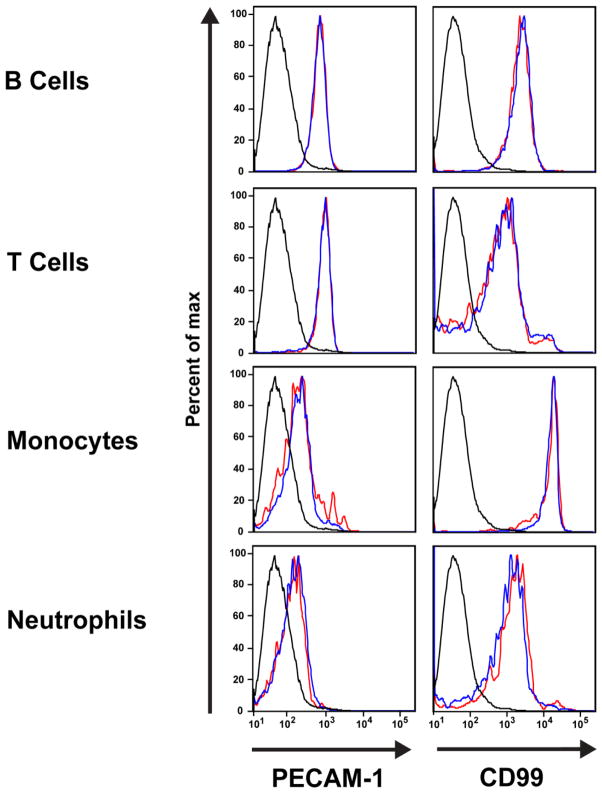
Figure 3. Expression of PECAM and CD99 is similar on leukocytes from wild-type and CD99L2−/− mice.
Flow cytometric profiles of PECAM and CD99 on leukocytes gated by forward and side scatter as well as cell-specific markers. At least 100,000 events were recorded per sample. Details of the full surface marker panel can be found in Materials and Methods. Black histogram = unstained negative control; blue histogram = wild-type; red histogram = CD99L2−/−.

