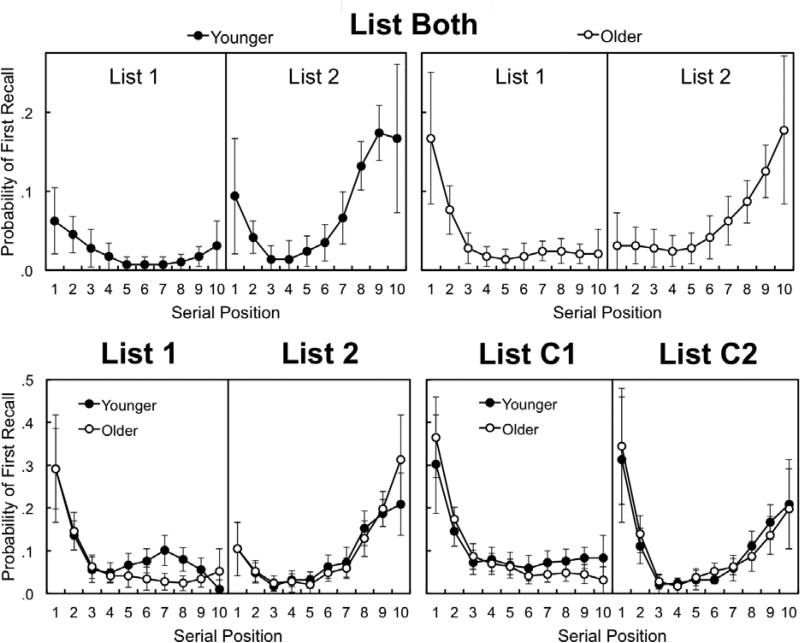
Figure 2.
Probability of first recall curves for younger and older adults in the List Both condition (top panels), the List 1 and List 2 conditions (bottom left panels), and the List C1 and List C2 conditions (bottom right panels). Data were averaged across three adjacent positions within each list for all positions except the first and last. Error bars are 95% confidence intervals calculated using a bootstrapping procedure.

