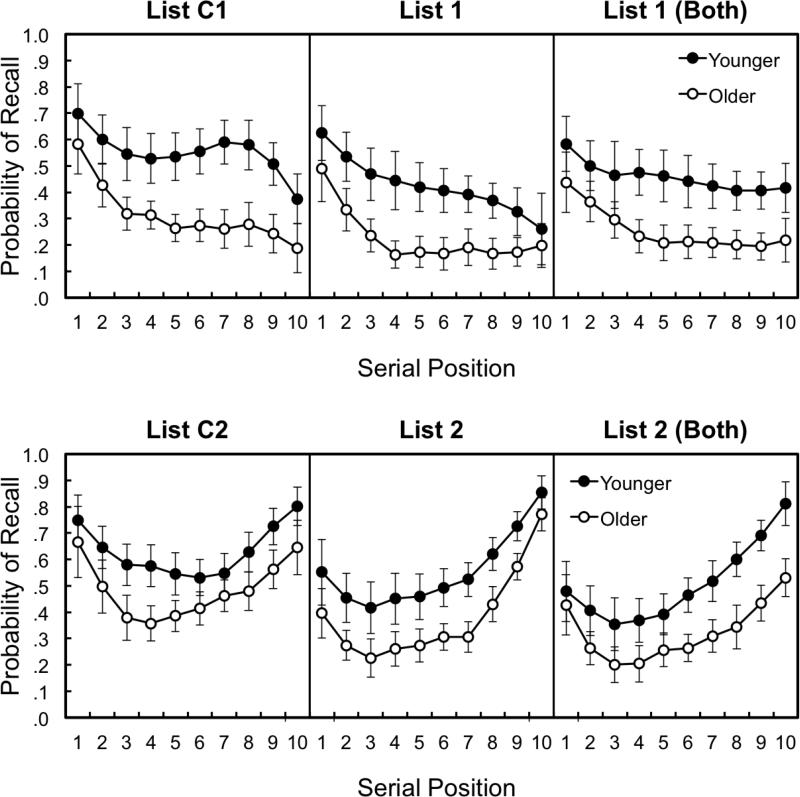
Figure 3.
Serial position curves for younger and older adults in the List 1 conditions (top panel) and List 2 conditions (bottom panel). Data were averaged across three adjacent positions for all positions except the first and last. Error bars are 95% confidence intervals calculated using a bootstrapping procedure.

