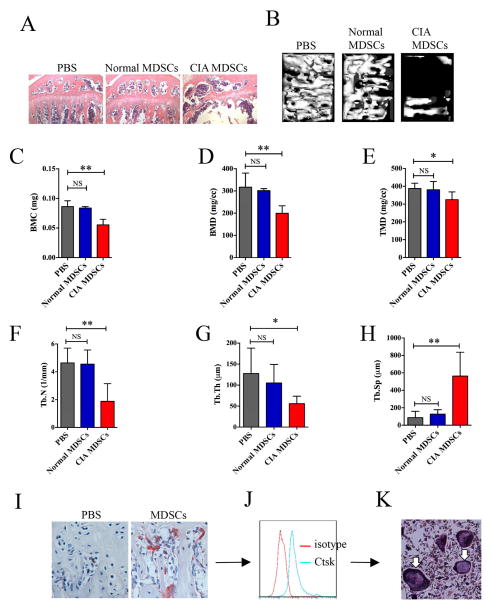
Figure 4. Osteoclasts derived from MDSCs isolated from mice with CIA are capable of bone resorption in vivo.
(A) Isolated MDSCs from mice with CIA or normal mice (CIA-MDSCs or Normal-MCSDs) were injected into the tibia of normal DBA/1J mice on day 0 and day 3. PBS was injected in the third group (PBS) as an additional control. Mice were sacrificed 12 days later. Tibia sections were stained by H&E. Representative images are presented. (B) Micro-CT showed trabecula in the tibia and representative images are presented. (C–H) Micro-CT analysis of 1.1mm × 0.8mm × 0.3mm bone tissue under the grow plate line of tibia. (C) BMC, bone mineral content. (D) BMD, bone mineral density. (E) TMD, tissue mineral density. (F) Tb.N, trabecular number. (G) Tb.Th, trabecular thickness. (H) Tb.Sp, trabecular separation. In (I) to (J), CFSE-labeled CIA-MDSCs were injected into the tibia of normal mice. Tibia slides were stained for TRAP. Representative images were presented (J). CFSE+ bone marrow cells were sorted and stained for Ctsk and analyzed by flow cytometry 12 days after injection (K). Sorted CFSE+ bone marrow cells were cultured in a medium containing 50ng/ml M-CSF and 100ng/ml RANKL for 24 hours. Osteoclast formation was confirmed by TRAP staining (white arrows). Data are shown as mean ± SD. Data are summarized from 5 mice of each group. *p<0.05, ** p<0.01.

