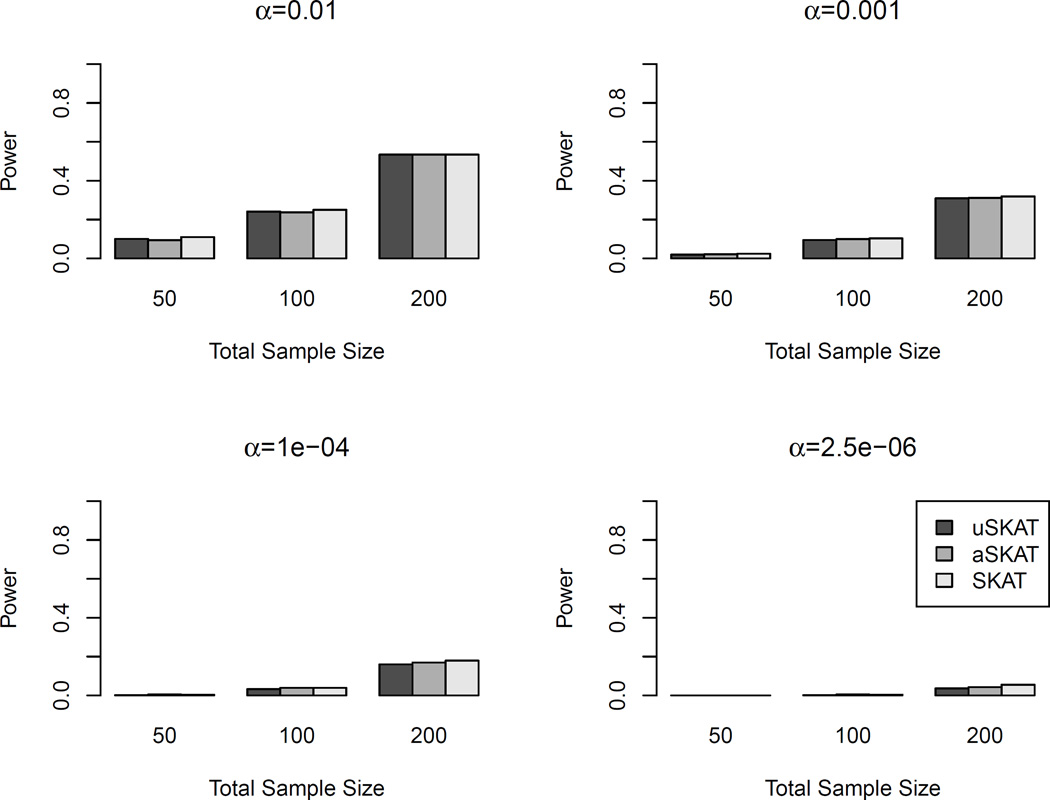
Figure 5.
Power comparison of binary traits with one common causal variant in human genetic association studies. The linear kernel was used. The causal variant was randomly sampled with MAF > 0.05. Total sample sizes considered were 50, 100 and 200. Significance levels considered were 0.01, 0.001, 10−4 and 2.5×10⁻⁶. 103 replicates were used to estimate the power.

