
Fig. 5.
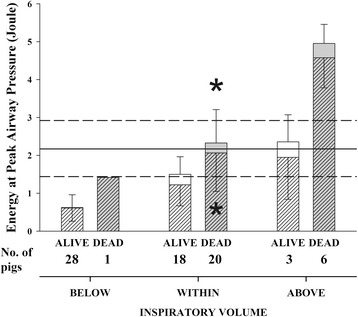
Outcomes of pigs and energy at peak airway pressure. Mean (± standard deviation) energy at peak airway pressure, expressed as joule. Pigs were grouped according to normalized inspiratory volume lower (BELOW), within (WITHIN) or higher (ABOVE) than normal inspiratory capacity. Pigs were also divided according to outcome: ALIVE (white bars) or DEAD (gray bars). The whole bar is composed of a dynamic component (coarse stack) and a static component (the stack with no pattern). A solid horizontal line indicates the average reference value of energy at 45 cmH2O airway pressure, medium-dashed lines represent mean ± 2 standard deviation reference values, i.e. the lower and the upper limits of the variable. Statistical analysis: two-way ANOVA on ranks (fixed effects: Inspiratory volume and Outcome). Total energy at peak airway pressure (entire bar) (Inspiratory volume P < 0.001, Outcome P < 0.001, Interaction = 0.804), dynamic energy at peak airway pressure (coarse pattern) (Inspiratory volume P = 0.005, Outcome P < 0.001, Interaction = 0.597), static energy at peak airway pressure (no pattern) (Inspiratory volume P = 0.002, Outcome P = 0.333, Interaction = 0.618). * P<0.05 between dead and alive pigs in the WITHIN group (see text for description)