
Figure 2. In vivo Phenotype of HSV-1 KOS and KOS1.1.
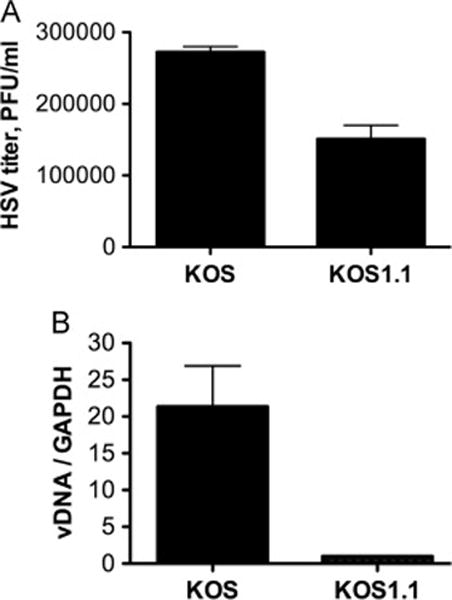
Groups of mice (n = 30/group) were infected with HSV-1 KOS or HSV-1 KOS1.1, as described in Materials and Methods. (A) Virus from eyeswabs of five HSV KOS- and five KOS1.1-infected mice during acute infection was titrated on Vero cells. Shown are mean values and standard error of the means. (B) Latent viral DNA from HSV KOS and KOS1.1-infected mice at 30 days postinfection was quantified by real-time PCR relative to a GAPDH cellular control gene during latent infection. Shown are the mean values and standard error of the means.