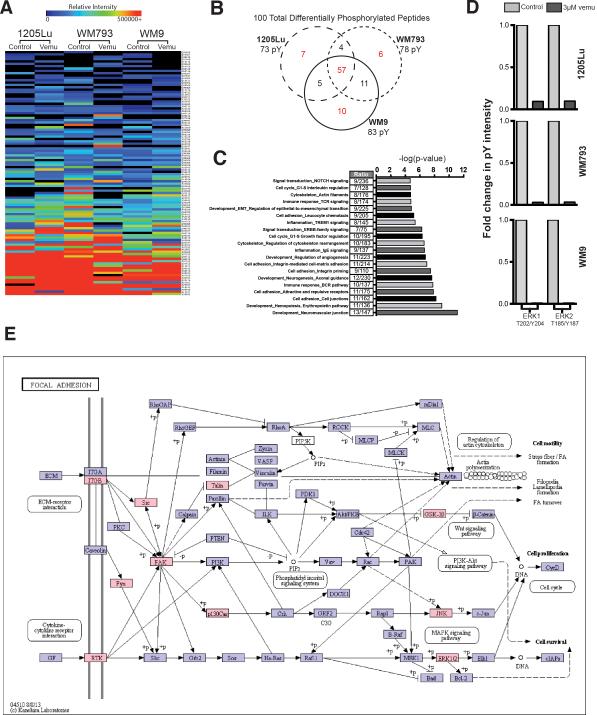
Figure 1. Phosphoproteomic analysis shows BRAF inhibition to upregulate adhesion signaling in BRAF6000E/PTEN- melanoma cell lines.
A: Heat map showing global changes in tyrosine phosphorylation in 3 melanoma cell lines following vemurafenib treatment (3 μM, 24 hrs, two replicates for each of the 3 cell lines). B: Venn-diagram showing the overlap of tyrosine-phosphorylated peptides following the treatment of 3 melanoma cell lines (1205Lu, WM793, WM9) with vemurafenib (3 μM, 24 hrs.). C: GeneGO network processes analysis of proteins exhibiting a miminum of 10% change in phosphorylation, identifies cell adhesion, regulation of the cytoskeleton and RTK signaling as being the pathways with significant alterations in tyrosine phosphorylation following BRAF inhibition. D: Bar graph showing changes in tyrosine phosphorylation of ERK1 and ERK2 in 3 melanoma cell lines following vemurafenib treatment (3 μM, 24 hrs.). E: KEGG pathway map identifying the activation of integrin-mediated adhesion/RTK 22 signaling following vemurafenib treatment, proteins with changes in phosphorylation (>10%) due to vemurafenib treatment depicted in pink.

