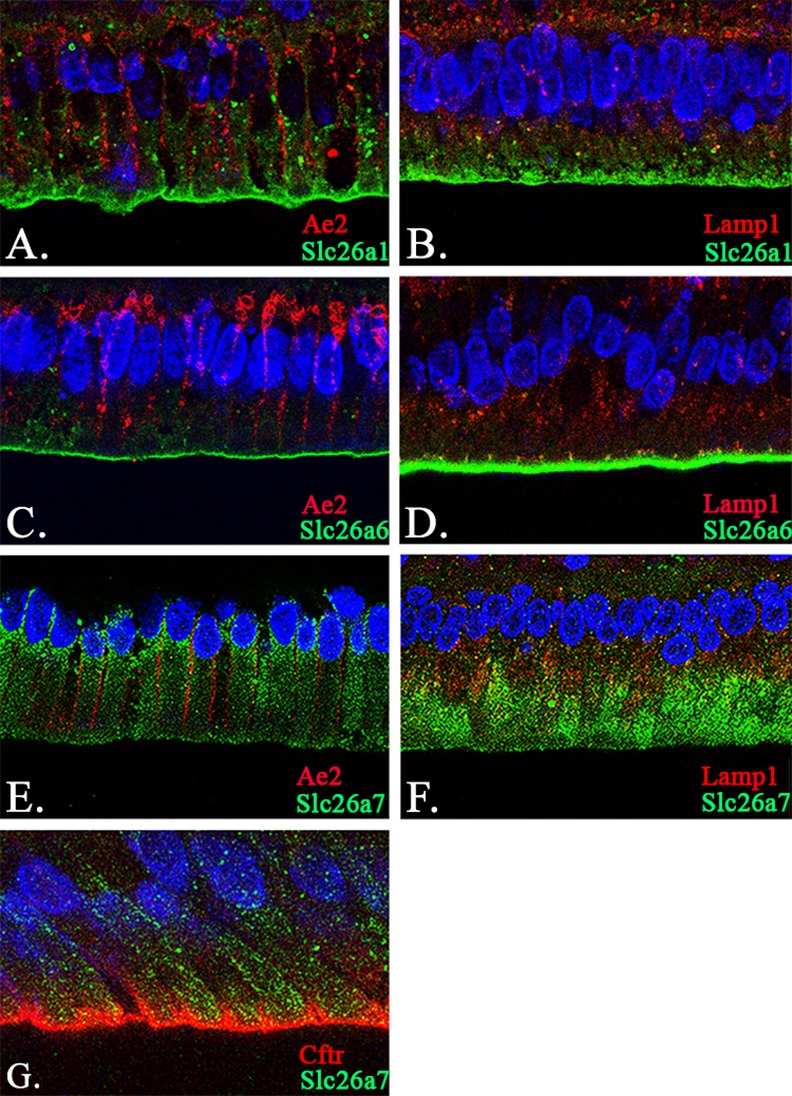
Fig 5. Co-localization analysis of Slc26a1, Slc26a6, Slc26a7 with Ae2, Lamp1 and Cftr.

(A-B) Co-localization of Slc26a1 with Ae2 and Lamp1 in maturation-stage ameloblasts by confocal microscopy at 63x magnification. The signals of Slc26a1 were mainly seen on the apical membrane of maturation-stage ameloblasts (Panels A and B; Green). In contrast, Ae2 was localized to the basolateral membrane (Panel A; Red) and the basal pole (Panel C; Red), while Lamp1 showed a cytoplasmic and/or peri-nuclear distribution pattern in ameloblasts (Panel B; Red). The sections were stained with DAPI to highlight the nuclei (Panels A and B; Blue). (C-D) Co-localization of Slc26a6 with Ae2 and Lamp1 in maturation-stage ameloblasts. Slc26a6 exhibited a similar expression pattern to that of Slc26a1—on the apical membrane of maturation-stage ameloblasts (Panels C and D; Green). The fluorescence signals of Ae2 (Panel C; Red) and Lamp1 (Panel D; Red) were used as references. The sections were stained with DAPI to highlight the nuclei (Panels C and D; Blue). (E-G) Co-localization of Slc26a7 with Ae2, Lamp1 and Cftr in maturation-stage ameloblasts. The expression of Slc26a7 was found both on the apical membrane and within the cytoplasmic region (Panels E-G; Green). The fluorescence signals of Slc26a7 partially overlapped with those of Lamp1 (Panel F; Red) and Cftr (Panel G; Red), rather than Ae2 (Panel E; Red). The sections were stained with DAPI to highlight the nuclei (Panels E-G; Blue). The images were collected under confocal microscopy (63x magnification). Scale bar shown in Panel G (10μm).
