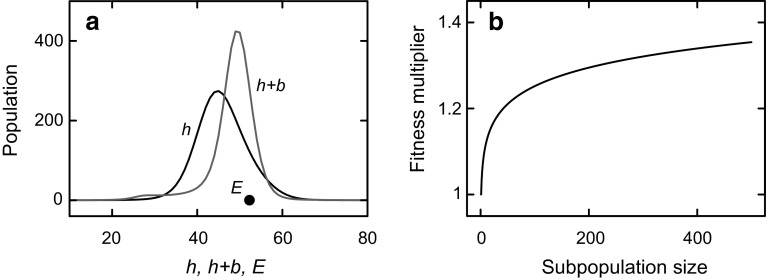
Fig. 2.
a Snapshot of the simulated evolution of a population with varying heredity h, varying behaviour b, and only direct fitness. The environment E varies continually and unpredictably. At the time shown, the value of E is given by the position of the black dot along the horizontal axis, the distribution of heredity in the population is given by the black curve marked ‘h’, and the distribution of phenotypes (p = h + b) is given by the grey curve marked ‘h + b’. In the simulation, b can vary 100 times faster than h (see the “Appendix” section), which results in h + b typically being closer to E than h. The distributions are drawn here as continuous curves for the sake of clarity, but h and b (but not E) are restricted to integer values. b Inclusive and extensive fitness are implemented by giving subpopulations of size n a fitness advantage by multiplying fitness by g log(n) (shown here as a function of n for g = 1.05). Subpopulations are defined by heredity h for inclusive fitness, and by phenotype p = h + b for the phenotypic part of extensive fitness (which incorporates inclusive fitness as well)

