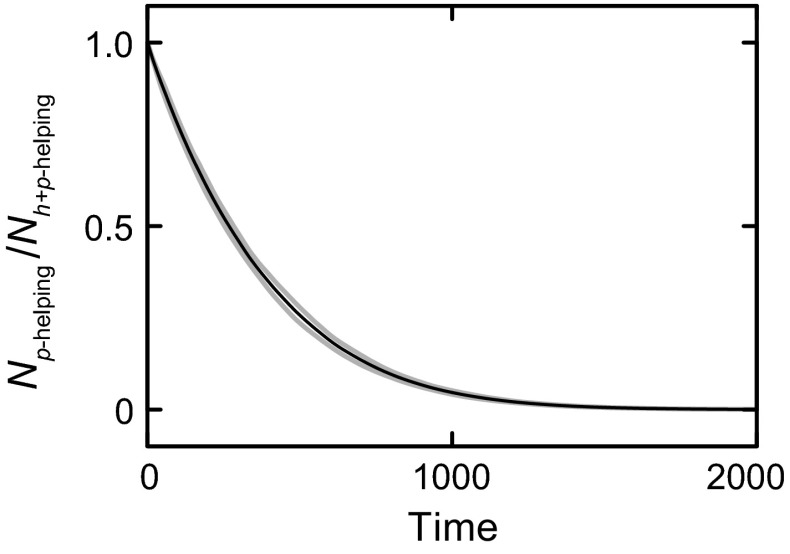
Fig. 5.
Populations with combined p- and h-helping outcompete populations with only p-helping. The lines show the ratio of the number of organisms in a population with p-helping (N p-helping) and one with h-helping from 50 % of the members of an organism’s h-group and p-helping from 50 % of the members of its p-group (N h+p-helping), as a function of time (100 time steps correspond to an organism’s lifetime). Black line mean of 100 simulations with different realizations of the environment E(t), grey lines mean ± SD

