Figure 2.

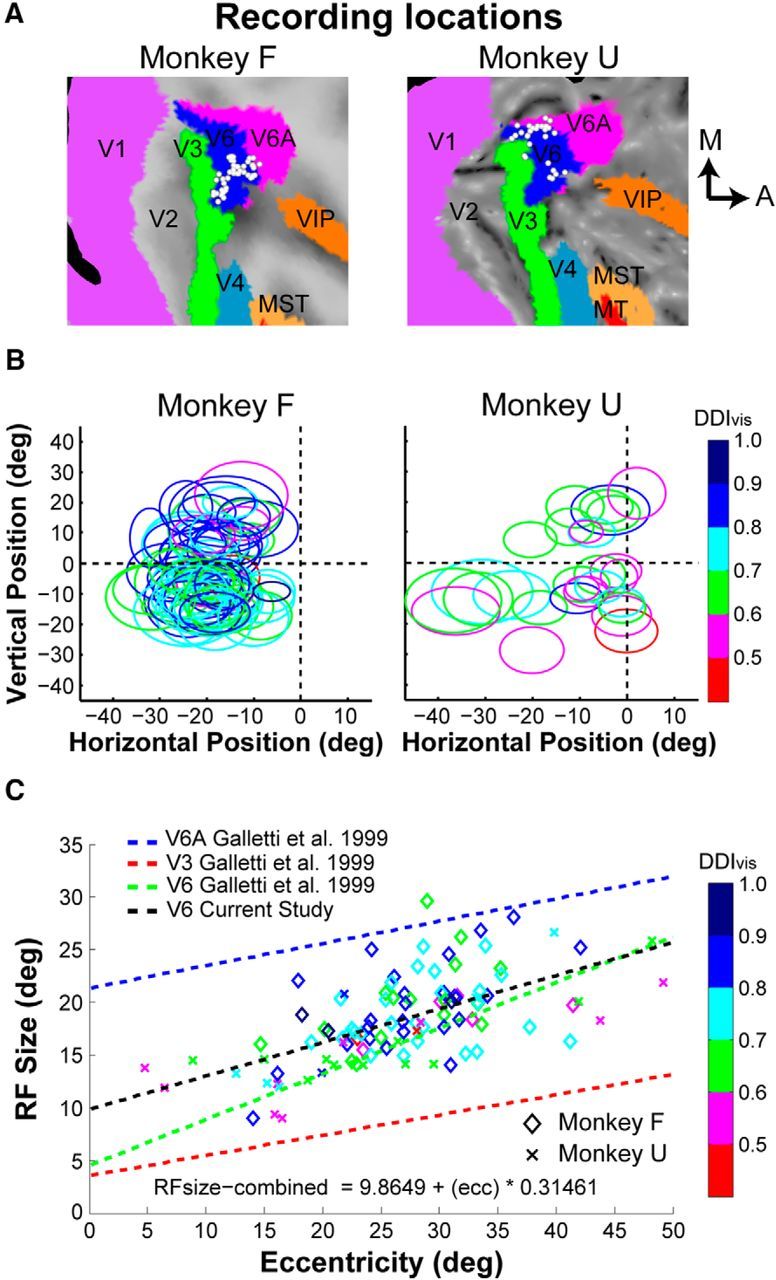
Recording locations in V6 and RF properties. A, Recording sites in V6 have been projected onto flattened MRI maps of each monkey using CARET software (see Materials and Methods). A, anterior; M, medial. B, RFs for each neuron are shown as ellipses, separately for each animal. The RFs are color coded to reflect the visual DDIvis value for each neuron. C, RF size (square root of RF area) is plotted as a function of eccentricity (n = 106 V6 neurons). The black trend line shows the linear regression fit for V6 neurons in this study, and this relationship is very similar to a previously reported trend (green line) for V6 (Galletti et al., 1999a). In contrast, the trend lines for areas V6A (blue line) and V3 (red line), from a previous report (Galletti et al., 1999a), show that RF sizes in V6 are distinct from those in V6A and V3.
