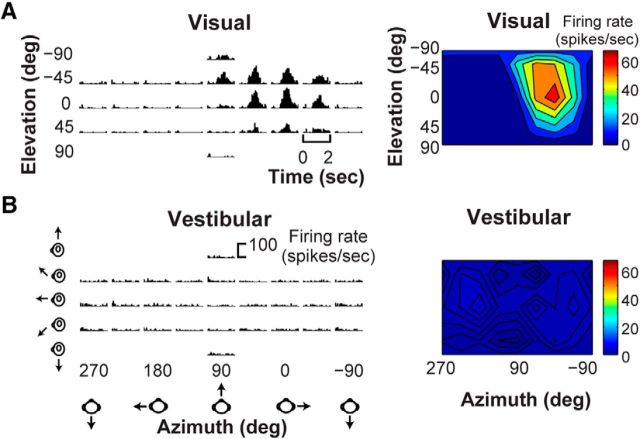
Figure 3.
3D heading tuning for an example V6 neuron. A, PSTHs (left) of responses of the example neuron to optic flow stimuli simulating 26 heading trajectories in 3D space. Visual heading tuning is summarized as a color contour map (right) using the Lambert cylindrical equal-area projection method (see Materials and Methods). B, PSTHs and the associated color contour map are shown for responses of the same neuron to vestibular heading stimuli.

