
Figure 4.
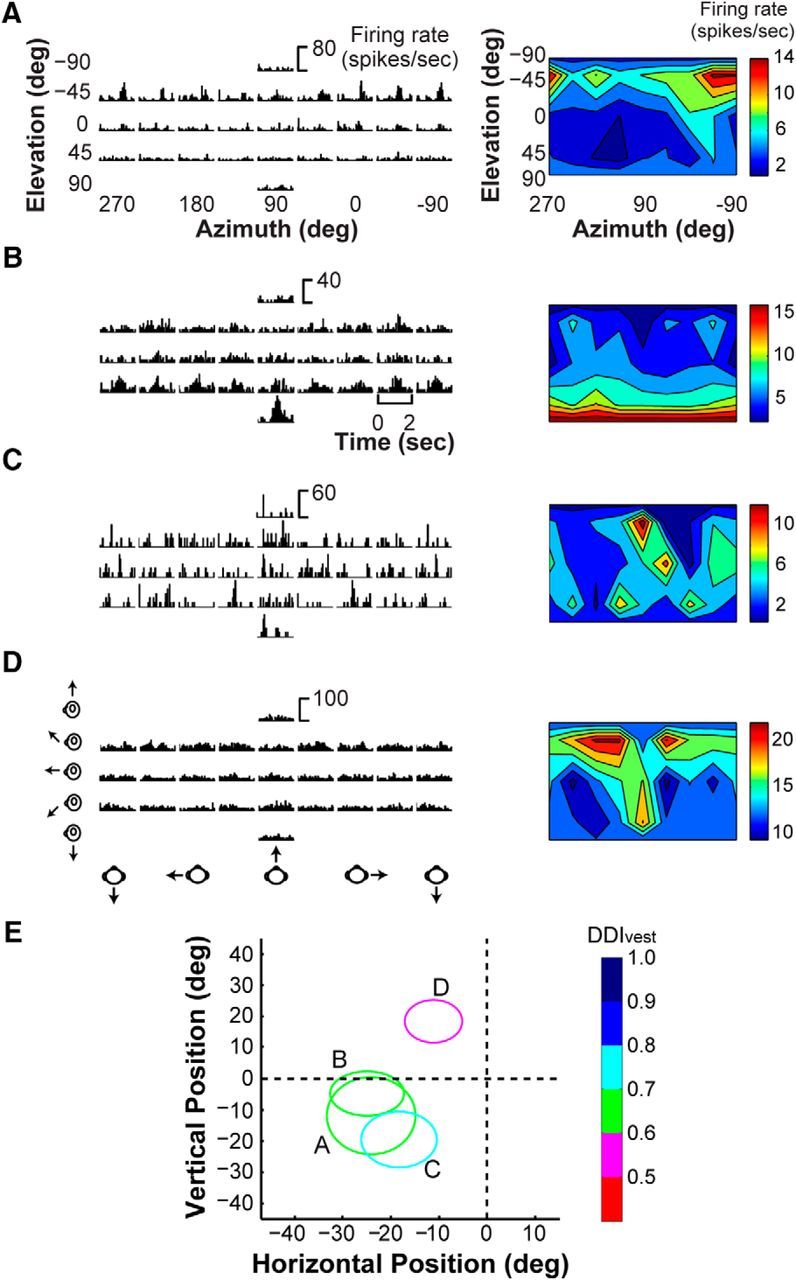
Neurons with statistically significant vestibular tuning in V6. A–D, PSTHs (left) of the responses of the four neurons with significant vestibular tuning based on our statistical criterion (ANOVA, p < 0.05) are shown. Their respective vestibular heading tuning profiles are shown as color contour maps (right), format as in Figure 3. E, RF positions for the neurons for which responses are plotted in A–D. RFs are color coded to reflect the vestibular DDIvest value for each neuron.