Figure 7.
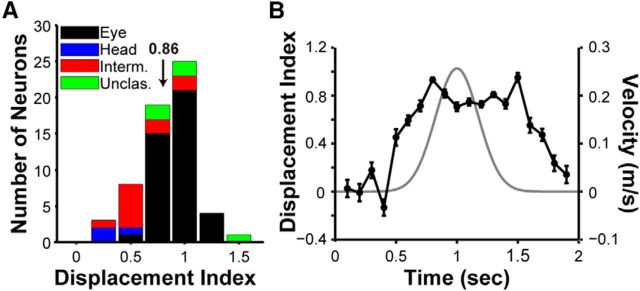
Quantification of reference frames by the DI. A, Distribution of DI values for V6 neurons with significant heading tuning for at least two fixation locations (n = 60). Arrow indicates mean DI (0.86). The stacked bars are color coded to classify neurons based on their reference frames. Black, eye-centered; blue, head-centered; red, intermediate (between eye- and head- centered); green, unclassified (see Materials and Methods). B, The time course of the DI (black line), as computed using a sliding window analysis (see Materials and Methods). Error bars indicate SEM. The gray curve shows the Gaussian stimulus velocity profile.

